The consolidation method allows traders to place tight stop-losses just outside the range, reducing the risk of losses. Consolidation is a useful tool for well-planned trades.
Types of consolidation in Forex
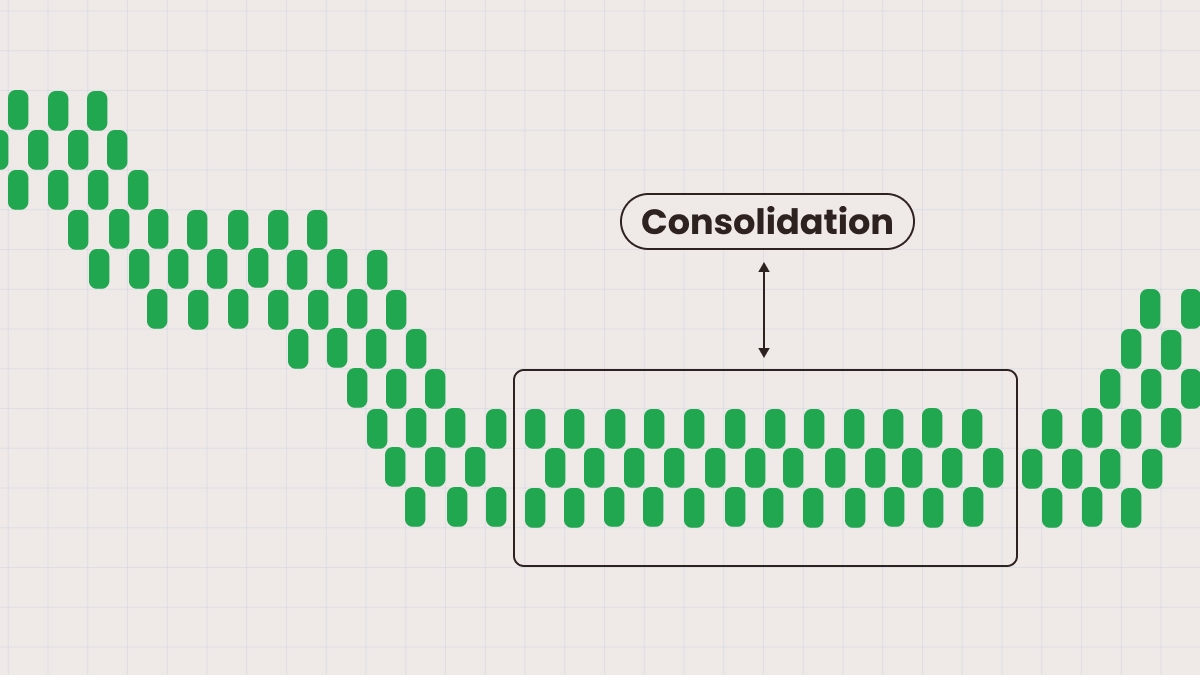
There are different types of consolidation, each characterized by the shape of the pattern. Each form has its own breakout potential.
The rectangular range is characterized by horizontal lines representing support and resistance levels within the range with clear limits. It is common among major currency pairs such as EURUSD.
Triangle patterns show large-scale movement as the market stabilizes. They can be symmetrical, ascending, or descending. Ascending triangles occur at higher, more stable highs and can signal a bullish trend. Descending triangles are the exact opposite and signal the beginning of a bearish trend. Symmetrical triangles can lead to breakouts in either direction and indicate equilibrium.
Flags and pennants are patterns that are formed after sharp trends and demonstrate short-term consolidation. These patterns are more reliable when the consolidation was stable and the trend was strong. They can signal that the trend will continue.
Wedges are characterized by a slower, more intense squeeze that can break out in either direction. Trend lines show that the highs and lows are either rising or falling at different rates, forming a wedge as they converge. Analysts consider the trend line an important indicator of a potential price reversal.
Low-volatility zones occur when the price of an asset changes only slightly. In these zones, assets do not bring high profits; but at the same time, they are protected from inflation and depreciation.
How to identify consolidation
Identifying consolidation early gives traders a big advantage during breakouts. There are a few key signs:
Flat and narrowing Bollinger Bands indicate a decrease in volatility, with the price falling between the bands, showing the market is ready to move.
ADX falling below 20 indicates a lack of trend. If you see a declining ADX and horizontal price movement, this is a strong sign of consolidation.
Moving averages become smoother. Price fluctuates between lows and highs without breaking out. The longer they remain this way, the higher the probability of a major breakout.
Market volumes are falling as traders are less active and there are fewer participants. Everyone is waiting for a breakout.
An RSI near 50 indicates that there is no clear trend.
Lower highs and higher lows compress the price into a triangle, indicating an imminent breakout.
New candles form and remain within the range of the previous candle, indicating a lack of volatility and indecision among market participants.
Use these signs together to determine the consolidation pattern most accurately.
Consolidation trading strategies
There are two main strategies for trading on consolidation.
• Wait for a breakout from the consolidation zone. Identify consolidation using the signs mentioned earlier, such as Bollinger Bands, ADX, RSI, low volume, and other indicators. Do not enter trades until the price breaks out of this range.
• Identify a volume spike or a candle closing outside the range. This signals that traders have become active and are interested in the move. You can wait for a full candle to close above resistance (for long positions) or below support (for short positions). This helps filter out false breakouts.
• Monitor news releases; breakouts work best when the move is driven by news and events.
• Match data with an economic calendar to predict volatility. Watch financial reports, interest rates, CPI, and others.
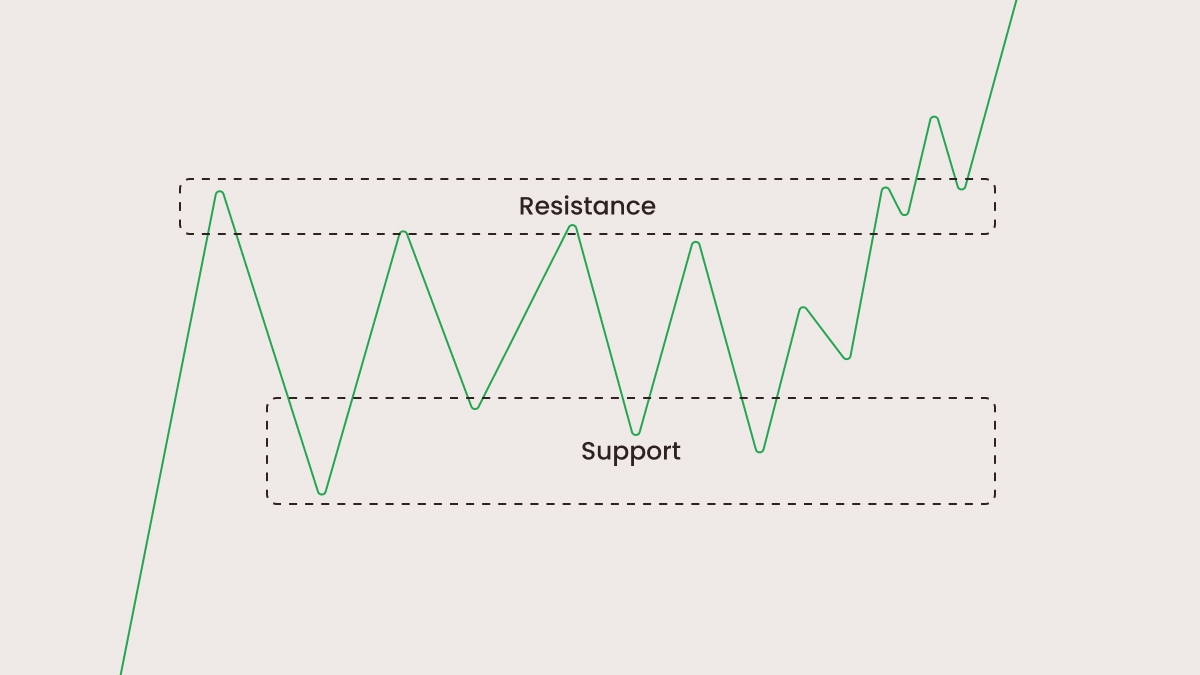
• Buy near support, sell near resistance. Find a sideways range where the price fluctuates between support and resistance. Your goal is to buy low and sell high. This works because a price often returns to the middle after reaching extremes during consolidation periods.
• Works best during periods of low news. Avoid periods leading up to important economic news as it may break the range; this strategy is suited for a quiet market.
• Confirm with RSI divergence or failed breakouts. If the price makes a new low at support but RSI makes a higher low, this signals a bullish trend. A failed breakout is when the price briefly breaks through support/resistance but quickly returns back inside the range.
• Works great for EURCHF and AUDNZD, as these pairs are slow-moving. These pairs often have long periods of sideways movement, which makes mean reversion more reliable.
Entry and exit tips during consolidation
Here are detailed steps for both strategies.
1. Breakout traders
• Entry: Wait for a full candle close above resistance to buy and below support to sell. The breakout candle should have a strong body, with most of it filled in, and the wick should not be long. Do not enter a trade when the price has just broken out of the range, as this may be a false breakout.
• Stop-loss (SL): Place a stop-loss inside the old range where the price should not return if the breakout is real. The stop-loss for a buy should be below the last low, and for a sell – above the last high. When in doubt, use a stop-loss of 1–2 candle bodies from the breakout — close enough to cut losses early, but far enough to avoid routine pullbacks.
• Take Profit (TP): Use a fixed R:R method, aiming for a reward-to-risk ratio of 1.5:1 or 2:1. For example, if you are risking 20 pips, aim for a profit of 30–40 pips. If the next major support/resistance level is closer or further away, adjust your take-profit accordingly. Market structure always trumps any arbitrary number.
2. Range Traders
• Entry: Wait for the price to reach resistance or support and look for a bounce signal: a Pin Bar (long wick bouncing off the level), a Tweezer (two candles with the same highs or lows), or an Engulfing (a candle completely covers the body of the previous one in the opposite direction). Go short at the resistance level or long at the support level after the bounce candle closes.
• Stop-loss (SL): Place the stop-loss just above the high of the wick of the bounce candle (if short) or just below the low of the wick (if long). This gives the trade some room to maneuver but protects against an actual breakout.
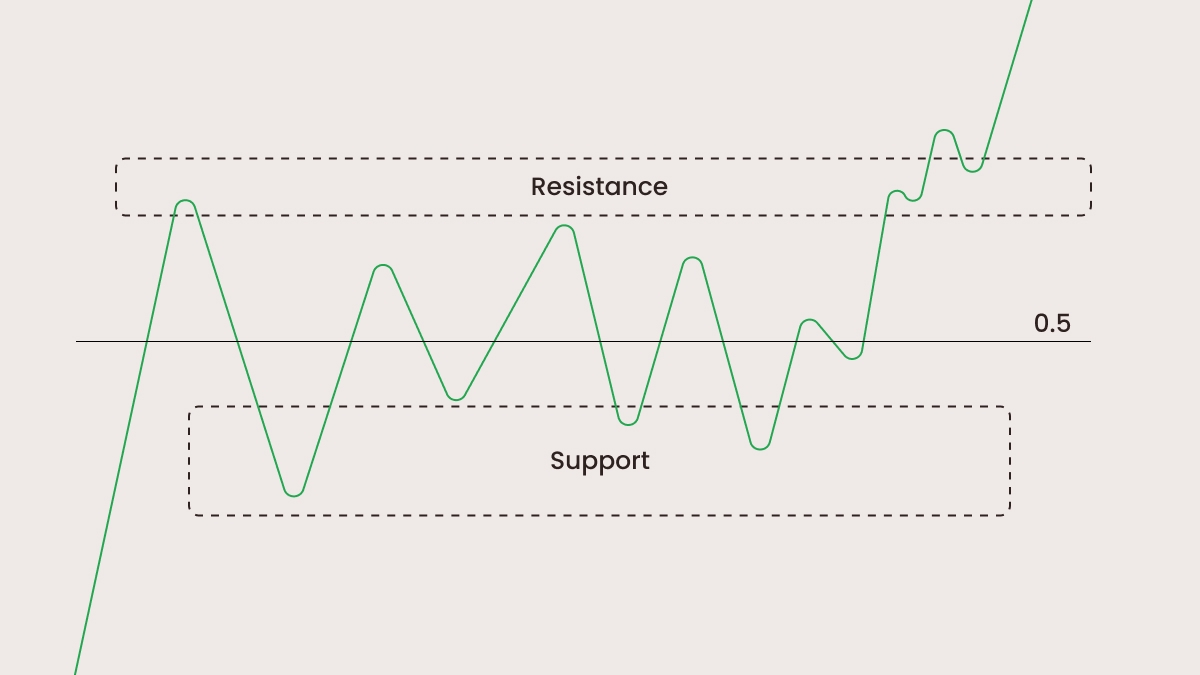
• Take-profit (TP): There are two targets. The first target is the middle of the range, where the price often bounces before reaching the opposite side. The second target is the opposite end of the range if the price shows strength by continuing to move in that direction. You can close half of the position at the first target and let the rest move to the second for a balanced approach.
Common mistakes & risk management in consolidation
Trading too early without confirmation. This error occurs when a trader enters the market as soon as the price touches the level without waiting for confirmation. Consolidation is often deceptive; the price may return to the previous range and knock the trader out of the market.
Overtrading occurs when a trader continues to open trades every time the price approaches the level, especially after false breakouts. Each false move depletes capital, so it is necessary to limit the number of attempts, for example, no more than 2-3 trades in one range.
No volume check occurs when a trader makes a trade on a breakout without checking if the market is active. Usually, a breakout without significant volume quickly fades and reverses. To avoid this error, watch for larger candles and faster price movement before entering a trade.
Ignoring structure is when a trader trades in an area full of peaks and uneven highs/lows. In a market that looks like that, all SL and TP will be based on guesswork. To avoid mistakes, trade only in ranges with clear, repeated touches (ideally 3+ times in both directions).
Setting no stop-loss can lead to unstable markets slowly destroying the account with many small losses. Always set a stop-loss so that in case of a mistake, the loss is small.
Risk control tips
Use smaller position sizes inside consolidation. Consolidation can be unpredictable as there can be quick reversals and false breakouts. Reduce the lot size to keep losses small if a loser occurs.
Wait for confirmation bars, as entering before the candle closes or before volume confirmation leads to sharp reversals. Only enter when there is clear confirmation and after the candle closes.
Trade fewer pairs, only where the structure is clean. More pairs create more noise. Focus on 1-3 pairs where the range high and low are obvious and have several clear touches.
Always define your R:R: don’t chase a big R:R. In consolidation, prices often move in small jumps, so unrealistic TP targets will not be reached. Before entering, define an accurate stop-loss and a realistic take-profit — even an R:R of 1.2:1 or 1.5:1 will do if the setup has a high probability of success.